

Space and Wildfires – Graine d’étoile Project

Authors: Téo JOUETTE and Sylvain LAGARENNE
Reviewers: Arthur DAUPHOLE-FOUILLE, Emmanuel GAUVRIT
PFor any feedback or suggestions, or if an error has slipped in despite our care, you can contact us on LinkedIn or at: contact@astres-espace.fr.
As of 26 August 2026, according to the European Forest Fire Information System [1], 96,461 hectares of forest have already burned in France. That is far more than the roughly 62,000 hectares burned over the whole of 2022, itself a record year. The French Forest Observatory tells us that 90% of these fires are of human origin, with one important caveat: only 30% of fires are criminal [2], the main natural cause of fire being lightning. So how can we explain such a rise in the area burned each year? Heatwaves and extreme heat have particularly dried out the French landscape, acting as a catalyst. As a result, the same trigger now has greater consequences in an environment where fire risk is higher: more forest fires, and more severe ones. Moreover, the increasing frequency and severity of heatwaves is directly linked to climate change, a long-term phenomenon whose consequences are already observable: according to Météo-France, the average temperature observed in mainland France over the 2015–2024 period corresponds to warming of 2.2 °C compared with the pre-industrial era [3]. Faced with this critical situation, which will not resolve itself on our timescale, many stakeholders are working to find and implement solutions to counter its consequences. The space sector plays a key role in the fight against wildfires and proves particularly effective at each of the three stages of a fire: anticipating it, confronting it, and repairing the damage it causes.
ANTICIPATING fires
The first step is therefore to anticipate fire risk. To do so, three types of indicators complement each other: the FWI (Fire Weather Index), the NDVI (Normalized Difference Vegetation Index) together with the LFMC (Live Fuel Moisture Content), and finally the SMI (Soil Moisture Index) together with the SMA (Soil Moisture Anomaly).
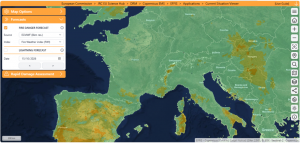
- The FWI [4], developed by the Canadian Forest Service, is a weather index that summarizes the level of wildfire risk in a single value. It is calculated by determining the soil moisture status at different depths from a set of data, some of which comes from space: air temperature, relative humidity, wind speed and precipitation, recorded daily. Integrated since 2007 into EFFIS (European Forest Fire Information System), the European service of the Copernicus satellite program [5], it is the operational reference for civil protection services across Europe. EFFIS publishes two indicators derived from the FWI, which provide more local information based on a record of about forty years: the ranking, which indicates where the value stands among those of the last 40 years (as a percentage), and the anomaly, which quantifies by how much the value deviates from the historical average, in number of standard deviations (the standard deviation measuring the usual range of variation around that average). For example, a ranking of 98% means that today’s value has been exceeded in only 2% of cases over the last 40 years, and an anomaly of +2 means that it deviates from the average by twice this usual range: in both cases, the situation is exceptional for the region and the season.
- The second type of indicators concerns the physiological state of the vegetation itself. The NDVI [6] assesses the density and vigor of the plant cover, based on the contrast between red light, which is absorbed by chlorophyll, and near-infrared light, which it reflects. The LFMC [7] represents the ratio between the mass of water and the dry biomass in living vegetation. It is a key parameter for both the probability of ignition and the speed of fire spread.
- Finally, the third type of indicators concerns the water reserve available in the soil, thanks to microwave radiometer satellites such as SMOS [8] and SMAP [9]. Their radiometer picks up the microwave radiation naturally emitted by the Earth’s surface, whose intensity is very sensitive to its water content [10]. This data is processed into two indicators: the SMI [11], a normalized value of volumetric moisture between 0 and 1, where 0 corresponds to a historically dry soil and 1 to a historically wet soil; and the SMA [12], a standardized deviation from the historical average, negative for a soil drier than normal and positive for a wetter one.
In addition to these three scales, to avoid false alarms, filters that account for, for example, certain industrial areas around the world are applied to satellite images, so that a hot spot caused by human activity is not mistaken for a fire.
It is the combination of these three tools that made it possible, in Greece, to identify precursor signals before eleven major fires that occurred between 2021 and 2023. Researchers observed NDVI values between 0.13 and 0.35 [13] in the areas that were about to burn, along with recurrent negative soil moisture anomalies measured by SMAP in the months preceding each fire outbreak. Combining these families of tools is necessary because, taken individually, they might not have been enough to sound the alarm, but once combined, they draw a clear map of the areas “ready to burn.”
CONFRONTING fires
Yet despite the risk forecasts and assessments made possible by advances in space technology, many fires still break out. Once a fire has started, the focus shifts from preventive diagnosis to real-time monitoring in support of emergency management. Many satellites take turns doing this, in two different types of orbit.
The whole challenge of monitoring from space comes down to a trade-off between seeing often and seeing precisely, and polar and geostationary satellites each make the opposite choice. Polar satellites, such as Suomi NPP, NOAA-20 and NOAA-21 [14], orbit at an altitude of about 800 km and fly over the Earth from pole to pole while it rotates beneath them. They detect the thermal signature of hot spots each time they pass over an area. This system can be pictured as a very precise thermometer scanning the Earth, but not continuously: each satellite passes over the same point only two to four times every 24 hours.
To fill this gap in continuity, geostationary satellites such as the European MSG/MTG (Meteosat Second/Third Generation) [15] remain fixed above the same region of the globe. Placed at an altitude of about 36,000 km in the equatorial plane, their angular velocity matches that of the Earth’s rotation, which makes them appear motionless from the ground. This allows them to update their coverage every 15 minutes, or even every 5 minutes for a rapid scan of Europe. Their American counterpart, GOES (Geostationary Operational Environmental Satellite), plays the same role over the American continent. It is the equivalent of a surveillance camera permanently trained on the whole of Europe, but at the cost of a much coarser spatial resolution. This loss of precision is not a mere technical choice but an unavoidable geometric constraint: the size of a pixel on the ground increases in proportion to the observation distance. Because of their very high altitude, geostationary satellites are limited to a resolution of about 1 km at best with current technology, compared with 375 m for polar satellites equipped with VIIRS, which orbit at only 800 km. Being roughly forty times closer to the Earth, the latter mechanically capture more detail per pixel. The two approaches are thus complementary rather than competing: one favors frequency, the other fineness of detail.
This fineness of the polar satellites relies largely on VIIRS (Visible Infrared Imaging Radiometer Suite) [16], which has become a reference for fire detection. This instrument is carried by the weather satellites Suomi NPP, NOAA-20 and NOAA-21 [14] and was designed to extend and improve the data previously collected by MODIS [17] and AVHRR [18]. Suomi NPP (National Polar-orbiting Partnership) is the first satellite of this program, launched jointly by NASA and NOAA, the U.S. National Oceanic and Atmospheric Administration, while NOAA-20 is its operational successor. VIIRS’s “active fires” product offers a resolution of 375 m per pixel, which clearly improves the detection of small fires and the mapping of large fire perimeters compared with its predecessors. This data feeds NASA’s FIRMS platform [19], widely used by civil protection services. In Europe, the equivalent of VIIRS is METimage, an imager carried on EUMETSAT’s new-generation polar satellites, Metop-SG.
Finally, hot spot detection is complemented by SWIR (Short-Wave Infrared) imagery, carried notably on Sentinel-2 and Sentinel-3 [20]. It uses a wavelength capable of penetrating smoke to precisely distinguish the active flame front from the area already burned, where conventional visible imagery would be blind.
We therefore generally have a combination of satellites that can effectively support the fight against fires. In the near future, improvements in AI models could also strengthen this system by providing real-time fire spread forecasts. A team from the University of Southern California, led by Assad Oberai [21], has developed a model combining generative AI and physical simulations to reconstruct fire progression from satellite data (VIIRS, GOES) and terrain. This model and the spread data it generates are a key step toward models capable of reliably predicting a fire’s future trajectory, which is of particular interest in the fight against wildfires.
RESTORING after fires
Once the flames are out, the story is not over. Beyond the disaster victims who need help, entire hectares of ecosystem have disappeared. Left to itself, nature will always recover: it has already survived five mass extinctions, so it will surely survive a forest fire! But this spontaneous recovery can take decades, even centuries, time that humanity doesn’t really have, given how vital forests are to us. Speeding up (sustainable) regrowth is therefore not a service we do for the planet, but for ourselves. And this is where space technology comes in, in three stages: mapping the damage, assessing its severity, and then supporting the recovery.
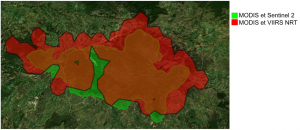
The first stage is almost administrative: how many hectares have gone up in smoke, and where exactly? This is the role of a European body such as EFFIS, which takes NASA’s FIRMS detections and adds its own layer of analysis: fire perimeters, burned areas, and a fire danger index forecast up to ten days ahead, which falls under anticipation. The core of this mapping is its rapid mapping module, the Rapid Damage Assessment (RDA), launched in 2003. Originally, it analyzed daily images from the MODIS instruments, carried on the Terra and Aqua satellites. Their resolution of 250 meters means that each pixel of the image, like a tile in a mosaic, covers a square 250 m on a side, or about 6 hectares: a fire only becomes visible if it covers several of these tiles. Hence a detection threshold of about 30 hectares, barely five pixels. Until 2018, the perimeters of fires larger than 30 hectares in Europe were updated twice a day. In 2016, the addition of the VIIRS sensor on board the Suomi NPP (NASA) and NOAA-20 satellites allowed one additional daily update. Since 2018, Sentinel-2 images have even been able to detect fires below the 30-hectare threshold: it is estimated that the areas mapped by EFFIS represent about 95% [1] of what burns each year in the European Union. Thus, like an insurance adjuster who comes to assess a loss, EFFIS fights nothing: it documents, measures and delineates. This analysis is refined over time: the first outlines remain estimates, gradually adjusted as new images become available, so the mapping is often more accurate after the fire than during the first hours of the event.
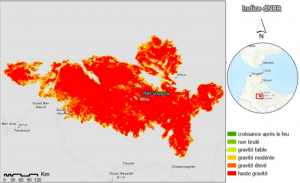
Beyond that, knowing where the fire passed says nothing about its severity. Two “burned” hectares can cover very different realities: an area merely scorched where the trees will survive, or completely sterilized soil that will take decades to rebuild. This is where the dNBR (delta Normalized Burn Ratio) [22] comes in, calculated by comparing the state of the vegetation before and after the fire using spectral bands sensitive to chlorophyll.
The fire perimeter and its severity (dNBR) are two different things. A study conducted in the Mediterranean region after a fire [23] illustrates this gap well: the severely burned area, identified by high dNBR values, covered about 46% of the study area, while more than 40% of the burned forest area had already regenerated. This difference for the same area shows why one should never rely on a single indicator. In the United States, the startup DroneSeed [24] already applies this logic: using swarms of drones equipped with multispectral cameras and high-end lidar, it maps the burned area, identifies the places where trees grow best, and then deploys packets of seeds and nutrients.
 Legend: dNBR index map [23]
 Legend: Map from the EFFIS website
CONCLUSIONS & OUTLOOK
Because of anthropogenic climate change, whose effects are very well documented, wildfires are increasing globally in frequency and intensity, and this phenomenon affects Europe in particular.
Indeed, according to an analysis of 21 years of satellite data by Jones et al. (2024), published in Science [25], global carbon emissions from forest fires increased by 60% between 2001 and 2023.
Even more alarming, extreme wildfire events have become 2.2 times more frequent between 2003 and 2023. The seven most recent years include six of the most extreme events ever recorded [26].
Another study analyzed the role of anthropogenic climate change in the exceptional fire season of summer 2022 in southwestern France. It estimates that climate change made fire-prone weather conditions comparable to those of July 2022 about twice as likely: their return period is 13 years in the current climate, versus about 29 years without climate change [27]. The same cause has also been identified in many other studies, notably on the 2025 events in France and Spain, or applying more broadly to Southern Europe.
And future projections are not much more positive: the IPCC’s Sixth Assessment Report (AR6) projects a general increase in fire risk across all European regions, particularly in southern Europe and the Mediterranean basin. The projections indicate that new fire-prone areas could emerge in western, central and northern Europe by the end of the century [28].
Moreover, the fire season is gradually lengthening in many regions, creating wider windows of risk that complicate operational planning and resource allocation.
Given that this trend is unavoidable in the short term, space technologies are all the more indispensable: not only for immediate fire management, but also for forecasting and risk management (upstream) and for monitoring carbon emissions and evaluating mitigation strategies (downstream). The ability to precisely map the extent and severity of damage makes it possible to refine climate models and to assess the effectiveness of ecological restoration measures as they are implemented. Beyond space technologies, international mobilizations are beginning to emerge. One example is the International Charter “Space and Major Disasters,” which can be activated in particular by any national disaster management authority. It provides access to the satellite data needed to manage an emergency (wildfires, floods, earthquakes, eruptions, storms, landslides, etc.). Since 2000, there have been more than 1,000 activations in more than 146 countries, thanks to nearly 270 contributing satellites.
While the climate outlook may seem alarming, solutions exist at every scale. In daily life, everyone can act through simple gestures, such as not tossing away a cigarette butt, which can be enough to start a fire. But beyond what each of us can do as citizens, some people bear an additional responsibility (public decision-makers, local authorities, companies) and have levers of a whole other magnitude: according to the European Investment Bank (EIB) [29], every euro invested in prevention and resilience avoids between 5 and 7 euros in repair costs. This logic is, moreover, widely supported, since 94% of Europeans say they favor climate change adaptation measures. In this context, it is essential to support initiatives such as the International Charter “Space and Major Disasters,” which puts satellite data at the service of populations affected by disasters, wherever they are.
Sources
[1] EFFIS, European Forest Fire Information System, 31 Aug 2026. [Online]. Available: https://forest-fire.emergency.copernicus.eu/.
[2] O. d. f. françaises, “Les causes des incendies de forêts et de végétation en France” [The causes of forest and vegetation fires in France], 13 Feb 2025. [Online]. Available: https://observatoire.foret.gouv.fr/themes/les-causes-des-incendies-de-foret-et-de-vegetation-en-france. [Accessed 6 Aug 2026].
[3] SDES, “Observations du changement climatique et de ses effets” [Observations of climate change and its effects], 2025. [Online]. Available: https://www.statistiques.developpement-durable.gouv.fr/edition-numerique/chiffres-cles-du-climat/fr/3-observations-du-changement-climatique-et. [Accessed 6 Aug 2026].
[4] “Fire Weather Index (FWI) – Dataset Description,” ECMWF, 2 Jul 2026. [Online]. Available: https://confluence.ecmwf.int/.../Fire+Weather+Index+FWI... [Accessed 14 Aug 2026].
[5] “Fire Danger Forecast,” Copernicus. [Online]. Available: https://forest-fire.emergency.copernicus.eu/about-effis/technical-background/fire-danger-forecast. [Accessed 14 Aug 2026].
[6] “Normalized difference vegetation index NDVI of the area affected by the fire,” ResearchGate, Aug 2014. [Online]. Available: https://www.researchgate.net/figure/Normalized-difference-vegetation-index-NDVI-of-the-area-affected-by-the-fire-NDVIs_fig1_266390250. [Accessed 14 Aug 2026].
[7] P. Xofis, “A Near-Real-Time Operational Live Fuel Moisture Content (LFMC) Product to Support Decision-Making at the National Level,” 30 Apr 2025. [Online]. Available: https://www.mdpi.com/2571-6255/8/5/178. [Accessed 14 Aug 2026].
[8] “Forecasting fires with SMOS,” ESA, 14 Jun 2023. [Online]. Available: https://www.esa.int/Applications/Observing_the_Earth/FutureEO/SMOS/Forecasting_fires_with_SMOS. [Accessed 14 Aug 2026].
[9] “Improved Forest Fire Danger Index estimate using SMAP soil moisture,” ADS, Dec 2020. [Online]. Available: https://ui.adsabs.harvard.edu/abs/2020AGUFMB034.0002S/abstract. [Accessed 14 Aug 2026].
[10] “SMOS,” CNES. [Online]. Available: https://cnes.fr/projets/smos. [Accessed 14 Oct 2026].
[11] “Validation and parametrization of the soil moisture index for stomatal conductance modelling and flux-based ozone risk assessment of Mediterranean plant species,” 15 Jul 2024. [Online]. Available: https://ars.els-cdn.com/content/image/1-s2.0-S0168192324001953-gr3.jpg.
[12] “ResearchGate.” [Online]. Available: https://www.researchgate.net/publication/379807328/figure/fig5/AS:11431281250771385@1718031239210/a-Probability-distribution-of-the-correlation-coefficient-r-for-soil-moisture-anomaly.png. [Accessed 31 Aug 2026].
[13] “Soil moisture and NDVI as factors to assess fire susceptibility - A case study in Greece,” ADS, Dec 2024. [Online]. Available: https://ui.adsabs.harvard.edu/abs/2024AGUFMH41K.0688G/abstract. [Accessed 14 Aug 2026].
[14] “NOAA-21, NOAA-20, and Suomi NPP satellite orbits,” NASA, 11 Oct 2022. [Online]. Available: https://svs.gsfc.nasa.gov/5021/. [Accessed 14 Aug 2026].
[15] “Météosat troisième génération” [Meteosat Third Generation], Wikipédia, 9 Aug 2026. [Online]. Available: https://fr.wikipedia.org/wiki/M%C3%A9t%C3%A9osat_troisi%C3%A8me_g%C3%A9n%C3%A9ration. [Accessed 14 Aug 2026].
[16] “Visible Infrared Imaging Radiometer Suite,” Wikipédia, 20 May 2026. [Online]. Available: https://fr.wikipedia.org/wiki/Visible_Infrared_Imaging_Radiometer_Suite. [Accessed 14 Aug 2026].
[17] “Moderate-Resolution Imaging Spectroradiometer,” Wikipédia, 17 Jun 2026. [Online]. Available: https://fr.wikipedia.org/wiki/Moderate-Resolution_Imaging_Spectroradiometer. [Accessed 14 Aug 2026].
[18] “Radiomètre Avancé à Très Haute Résolution” [Advanced Very High Resolution Radiometer], Wikipédia, 9 Dec 2025. [Online]. Available: https://fr.wikipedia.org/wiki/Radiom%C3%A8tre_Avanc%C3%A9_%C3%A0_Tr%C3%A8s_Haute_R%C3%A9solution. [Accessed 14 Aug 2026].
[19] “Providing Active Fire Data for Near-Real Time Monitoring and Applications,” NASA. [Online]. Available: https://firms.modaps.eosdis.nasa.gov/. [Accessed 14 Aug 2026].
[20] “Petite histoire de la deuxième bande SWIR de Sentinel-2” [A short history of Sentinel-2’s second SWIR band], CESBIO, 20 Jul 2018. [Online]. Available: https://www.cesbio.cnrs.fr/multitemp/petite-histoire-de-la-deuxieme-bande-swir-de-sentinel-2/. [Accessed 14 Aug 2026].
[21] N. Koutsias, “Generative Algorithms for Wildfire Progression Reconstruction from Multi-Modal Satellite Active Fire Measurements and Terrain Height,” 10 Jan 2026. [Online]. Available: https://www.mdpi.com/2072-4292/18/2/227. [Accessed 14 Aug 2026].
[22] “Comparative Analysis of dNBR, dNDVI, SVM Kernels, and ISODATA for Wildfire-Burned Area Mapping Using Sentinel-2 Imagery,” MDPI, 25 Jun 2025. [Online]. Available: https://www.mdpi.com/2072-4292/17/13/2196. [Accessed 26 Aug 2026].
[23] E. B. ,. N. A. e. H. M. LAKHOUAJA El houcine, “CONTRIBUTION DE LA TÉLÉDÉTECTION SPATIALE A L’ÉTUDE DES INCENDIES” [Contribution of space-based remote sensing to the study of fires]. [Online]. Available: http://www.meteo.fr/cic/meetings/2022/aic/resumes/teledetection_lakhouaja.pdf. [Accessed 26 Aug 2026].
[24] “DroneSeed.” [Online]. Available: https://doodlelabs.com/case-studies/droneseed/. [Accessed 26 Aug 2026].
[25] Jones et al., “Global rise in forest fire emissions linked to climate change in the extratropics,” Science, 2024. [Online]. Available: https://www.science.org/doi/10.1126/science.adl5889. [Accessed 16 Oct 2026].
[26] Calum X. Cunningham, Grant J. Williamson, David M. J. S. Bowman, “Increasing frequency and intensity of the most extreme wildfires on Earth,” Nature Ecology & Evolution, 2024. [Online]. Available: https://www.nature.com/articles/s41559-024-02452-2. [Accessed 16 Oct 2026].
[27] Lanet et al., “Attribution of summer 2022 extreme wildfire season in Southwest France to anthropogenic climate change,” npj Climate and Atmospheric Science, 2024. [Online]. Available: https://www.nature.com/articles/s41612-024-00821-z. [Accessed 16 Oct 2026].
[28] IPCC, AR6, “Climate Change 2022: Impacts, Adaptation and Vulnerability. Working Group II Contribution to the Sixth Assessment Report of the Intergovernmental Panel on Climate Change,” 2023. [Online]. Available: https://www.ipcc.ch/report/ar6/wg2/chapter/chapter-13/. [Accessed 16 Oct 2026].
[29] “94% of Europeans support measures to adapt to climate change, according to EIB survey,” European Investment Bank. Available: https://www.eib.org/en/press/all/2024-406-94-of-europeans-support-measures-to-adapt-to-climate-change-according-to-eib-survey. [Accessed 16 Oct 2026].